Turning dispute complexity into actionable clarity.
A clearer view of what changed, what needs attention, and where the strongest recovery opportunities are. Explore six connected parts of the experience below.
- My contribution
- Dashboard strategy, information architecture, dispute-health KPIs, case details, alerts, reporting, and natural-language analytics.
- The focus
- Help merchants understand which disputes need attention, inspect the evidence, and make an informed response.
- The experience
- Six connected views of outcomes, volume, case details, alerts, reporting, and natural-language analysis.1
Lead with what matters.
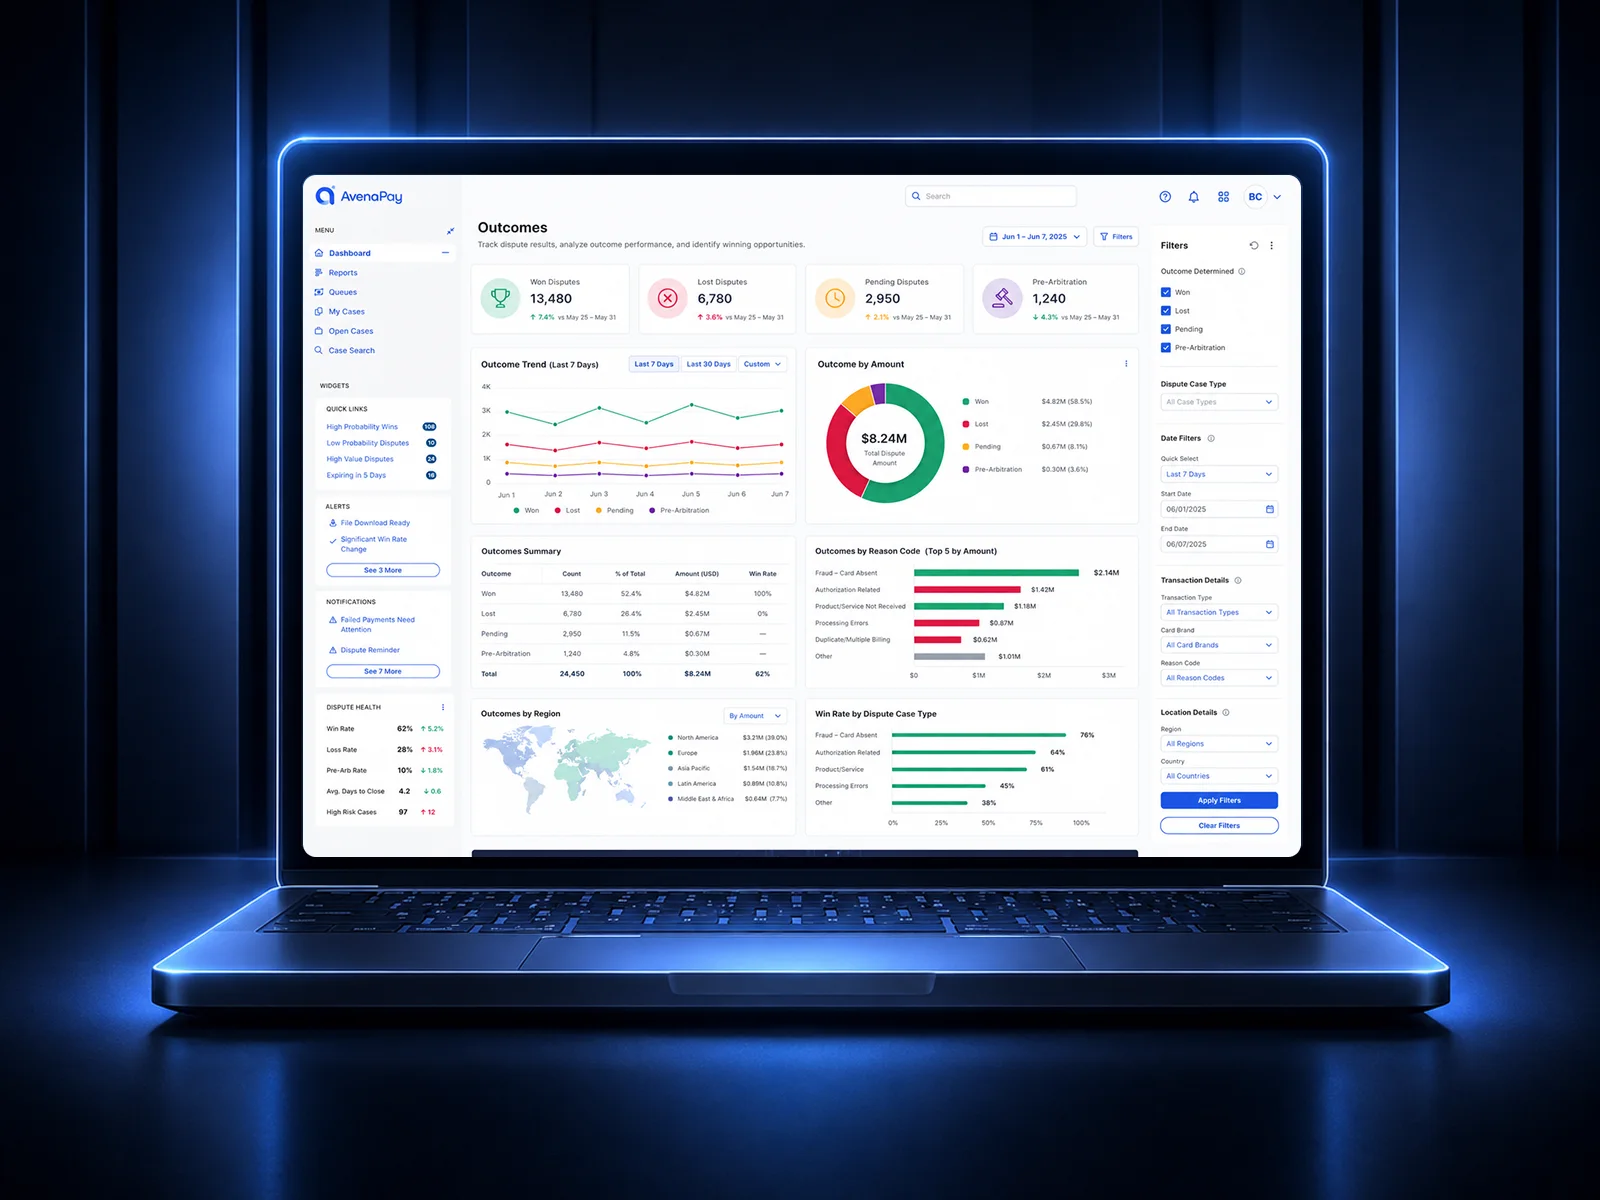
Recovery, loss, and pending value belong in the same conversation. The outcomes dashboard connects performance over time with the money behind it, helping merchants see where results are improving and where a closer look is needed.
Try changing the reporting period or isolating an outcome in the filters.
Recovery, loss, and pending value belong in the same conversation. The outcomes dashboard connects performance over time with the money behind it, helping merchants see where results are improving and where a closer look is needed.
Interactive controls become available when the demonstration loads.
Interactive example 1
Give every spike context.
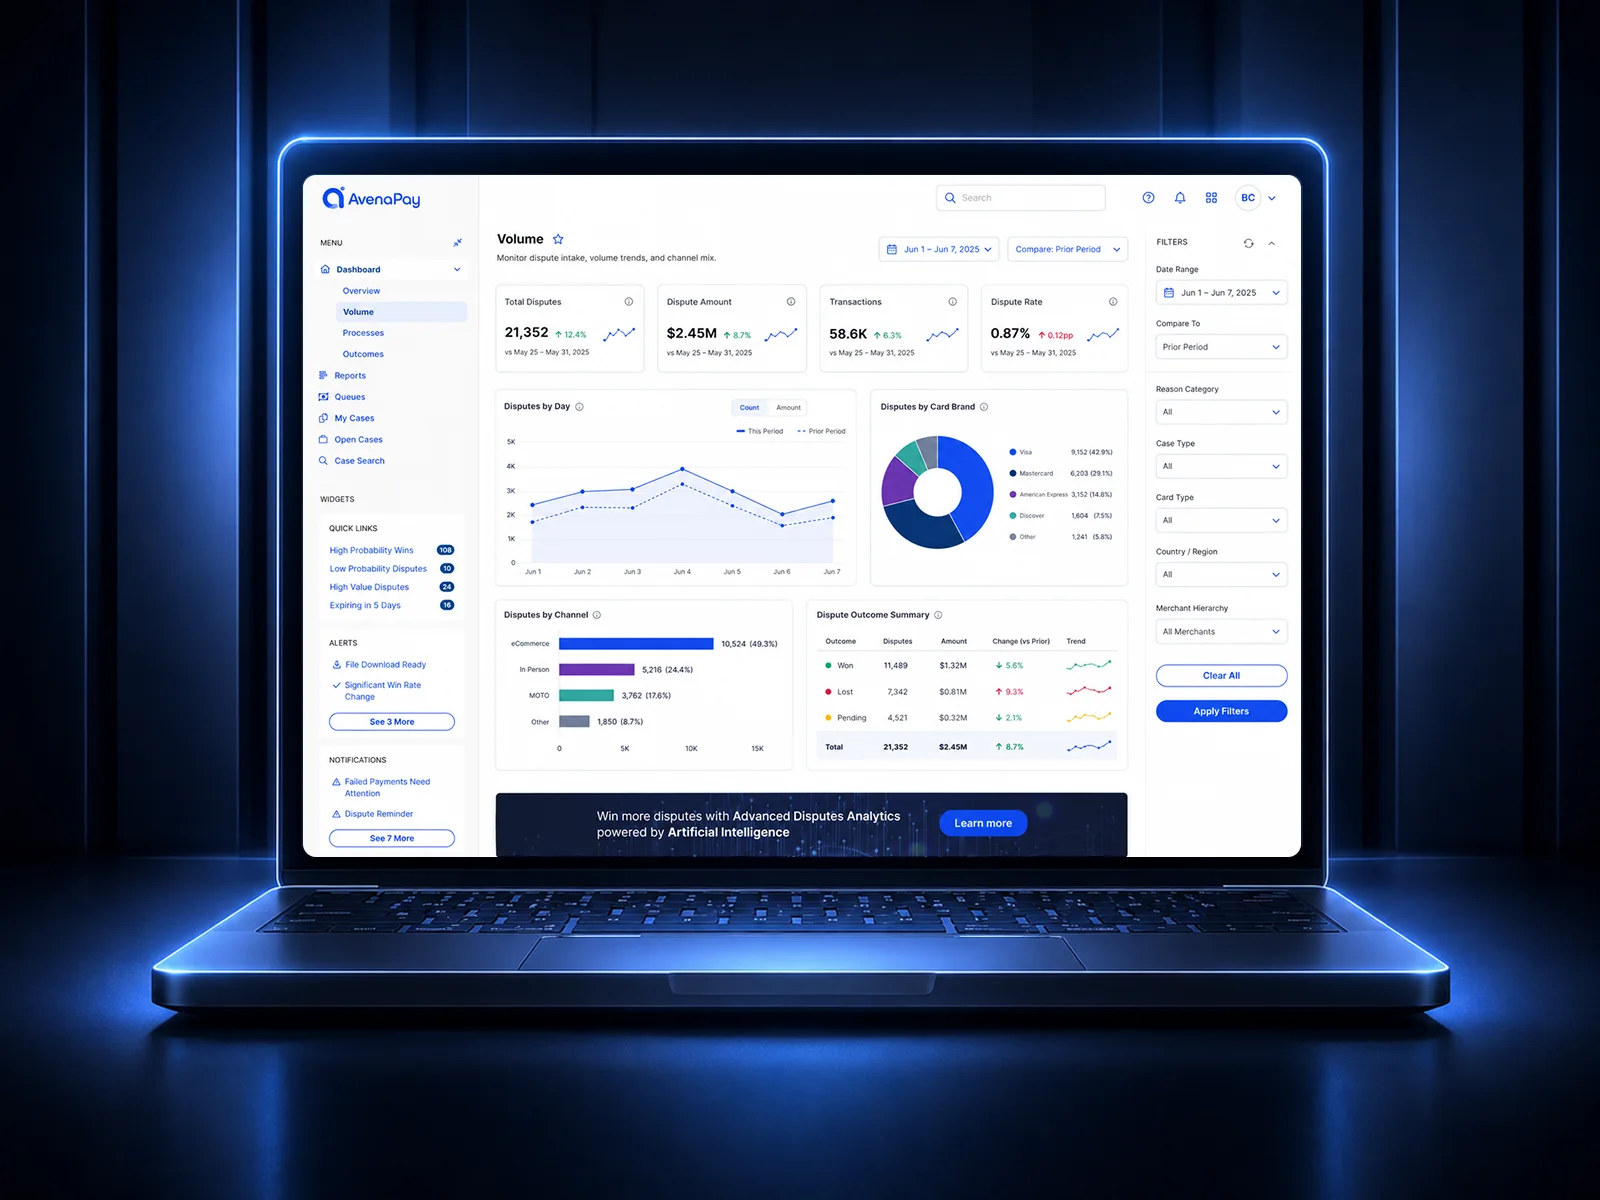
More disputes do not always tell the whole story. Volume, transaction activity, card mix, and channel trends sit together so teams can distinguish a change in business activity from a change in dispute risk.
Switch between count and amount, then compare a specific card brand.
More disputes do not always tell the whole story. Volume, transaction activity, card mix, and channel trends sit together so teams can distinguish a change in business activity from a change in dispute risk.
Interactive controls become available when the demonstration loads.
Interactive example 1
Bring the evidence to the decision.
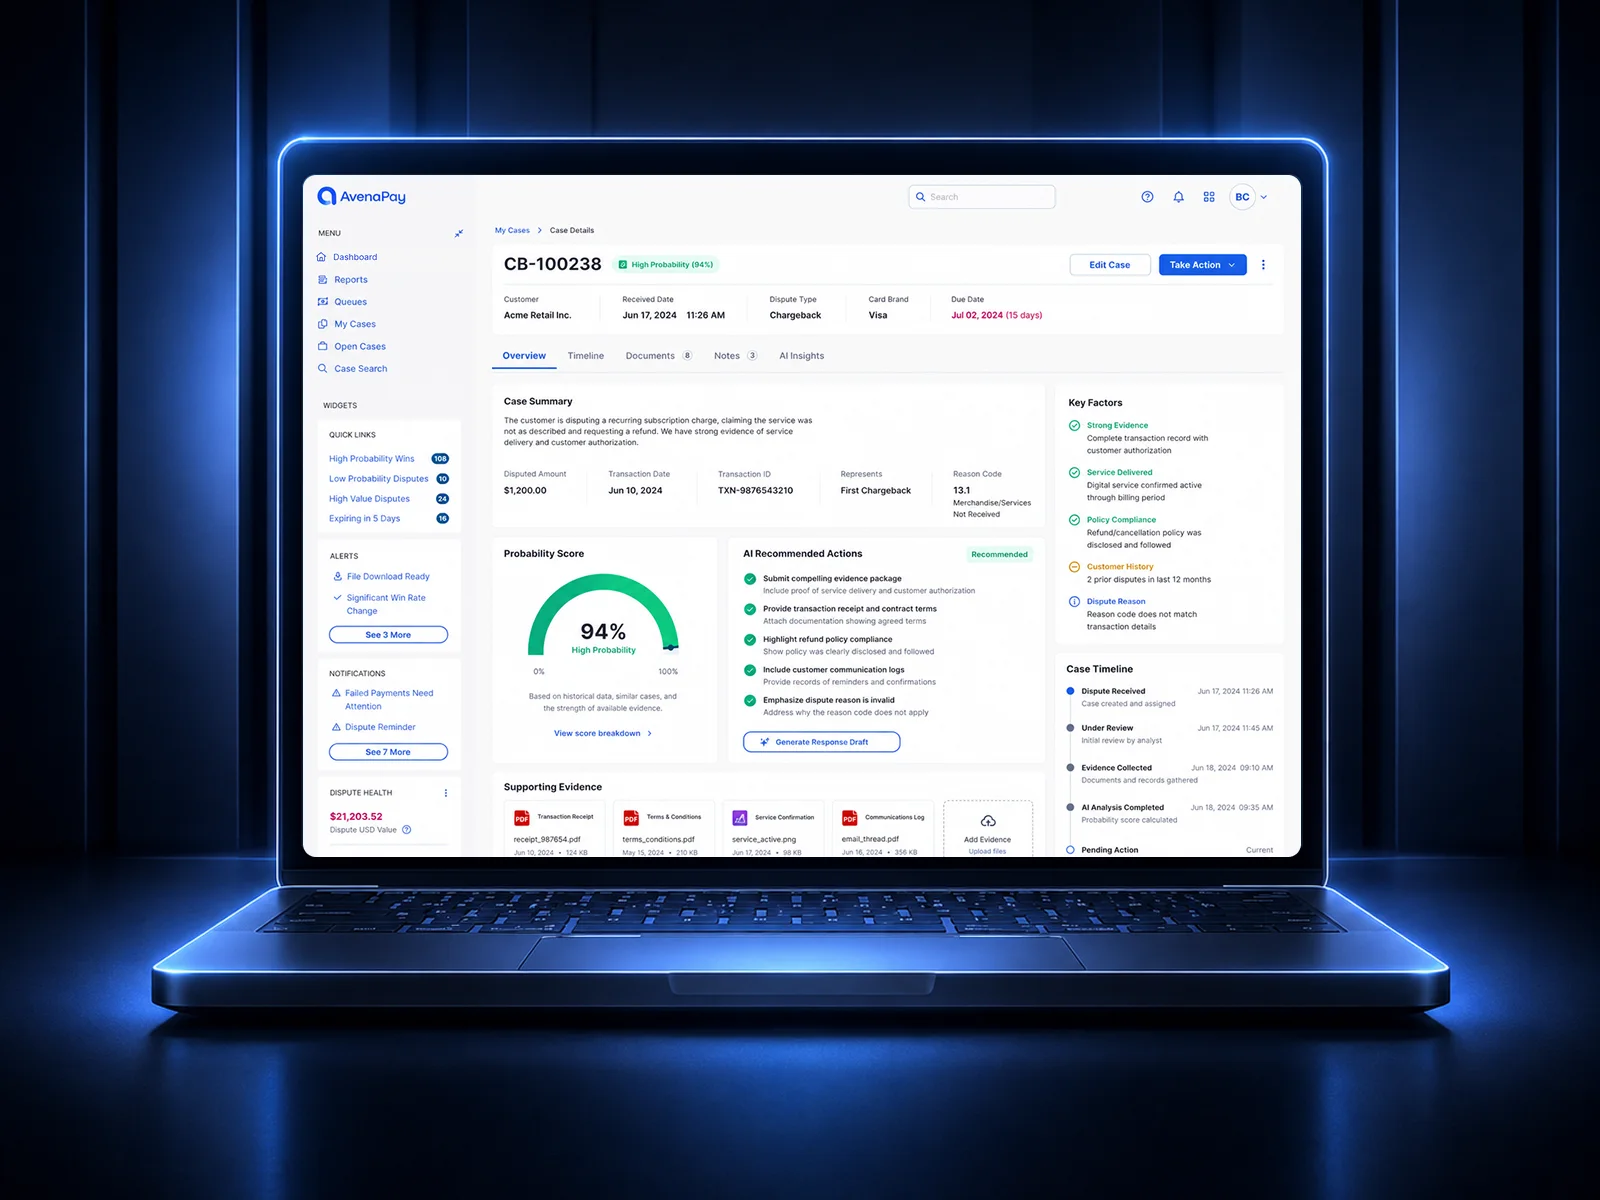
A case is more than its status. The detail view brings the amount, deadline, supporting documents, and recommended next steps into one place. A probability score provides context—not a guarantee—while the evidence stays available for human review.
Explore the case tabs, review the evidence, and prepare a sample response.
A case is more than its status. The detail view brings the amount, deadline, supporting documents, and recommended next steps into one place. A probability score provides context—not a guarantee—while the evidence stays available for human review.
Interactive controls become available when the demonstration loads.
Interactive example 1
Direct attention. Reduce noise.
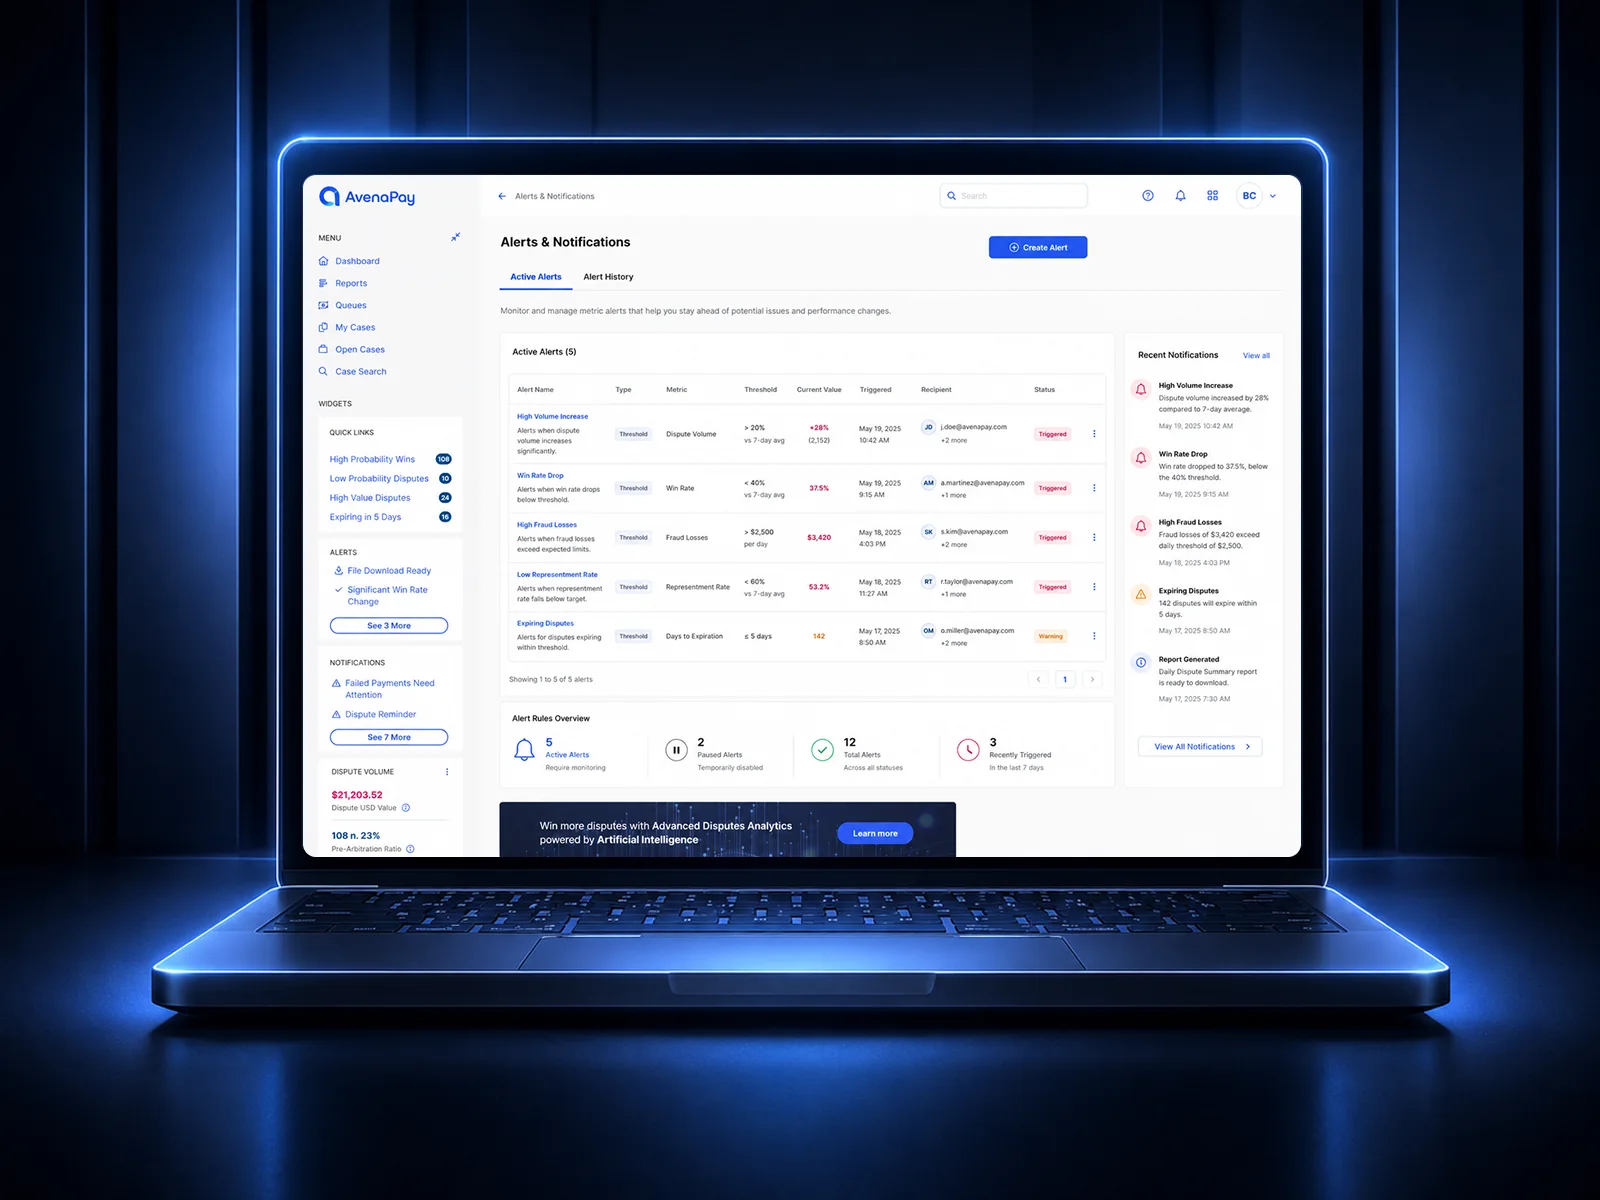
Meaningful thresholds make it easier to notice a rise in dispute volume, a falling win rate, or an approaching deadline. The alert center separates active signals from history and gives teams control over what they monitor.
Pause a rule or create a sample alert with your own threshold.
Meaningful thresholds make it easier to notice a rise in dispute volume, a falling win rate, or an approaching deadline. The alert center separates active signals from history and gives teams control over what they monitor.
Interactive controls become available when the demonstration loads.
Interactive example 1
Turn activity into a clear story.
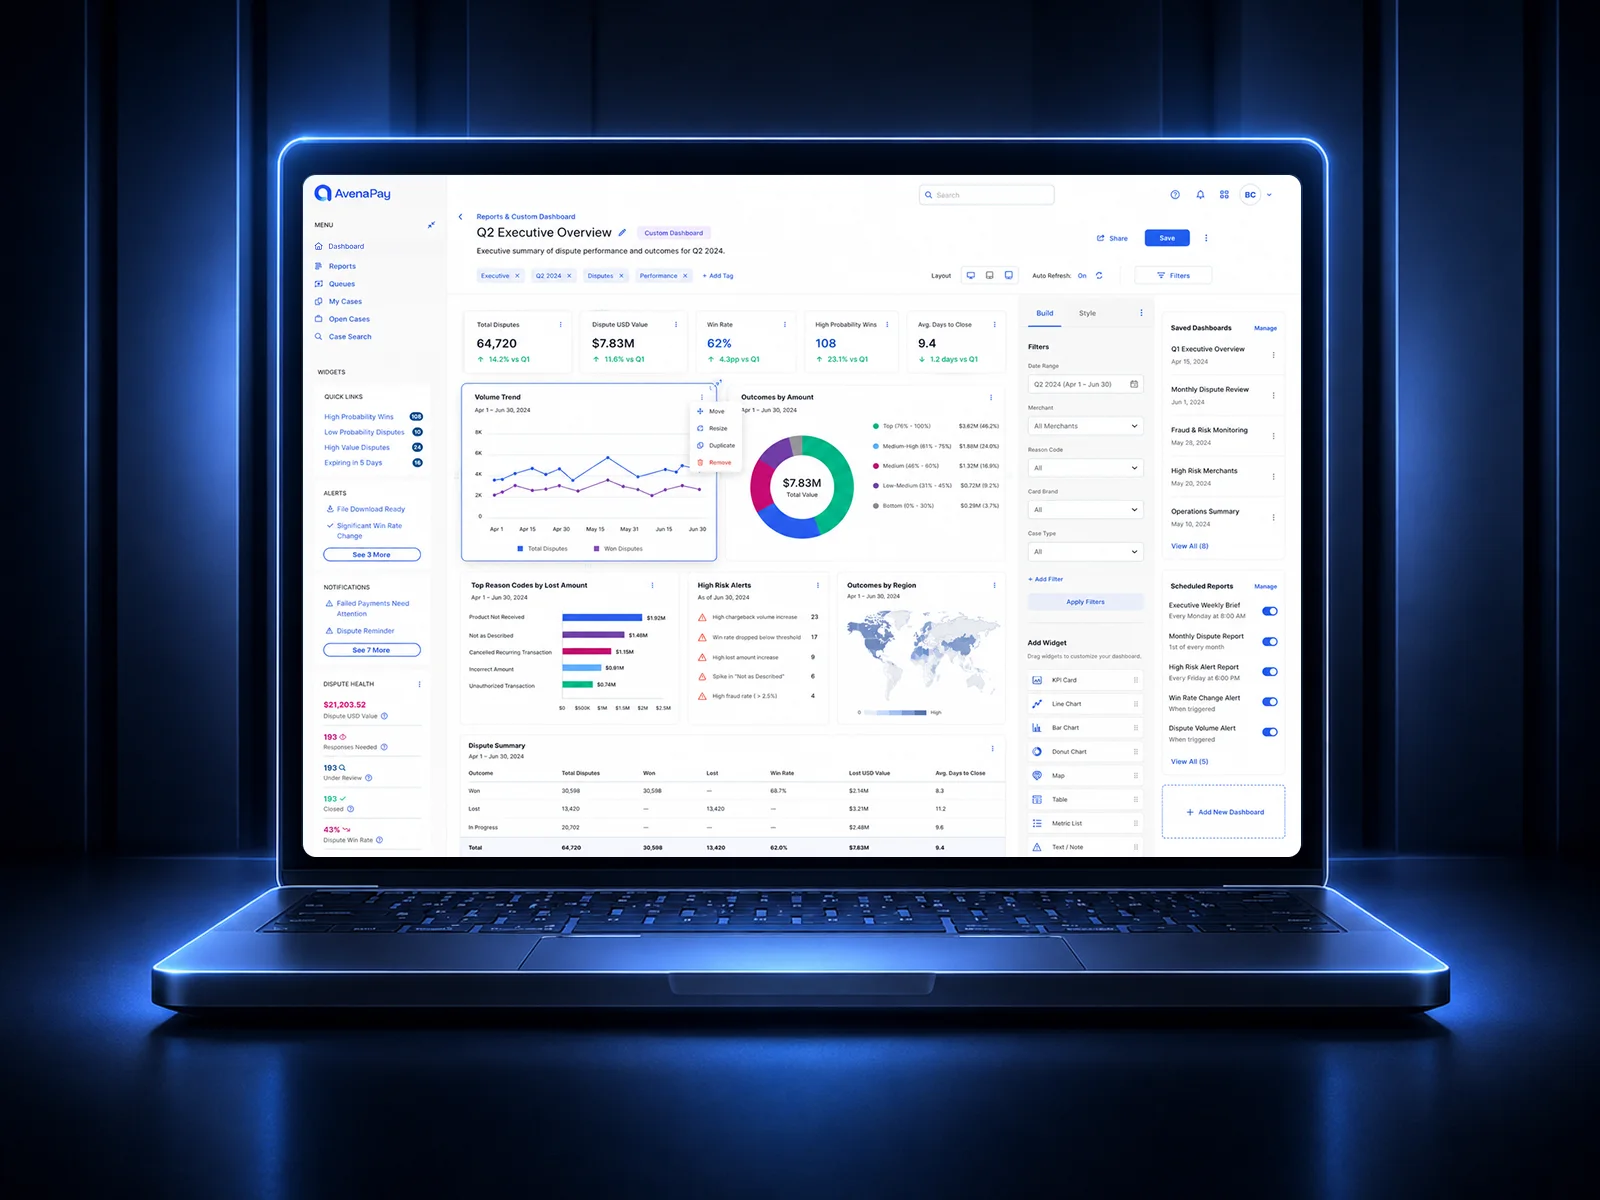
The executive overview brings recovery, risk, and operational performance into a single report. Reusable widgets let teams focus the view on the questions they need to answer without assembling another spreadsheet from scratch.
Choose a quarter, show or hide report widgets, and save the sample view.
The executive overview brings recovery, risk, and operational performance into a single report. Reusable widgets let teams focus the view on the questions they need to answer without assembling another spreadsheet from scratch.
Interactive controls become available when the demonstration loads.
Interactive example 1
Start with a better question.
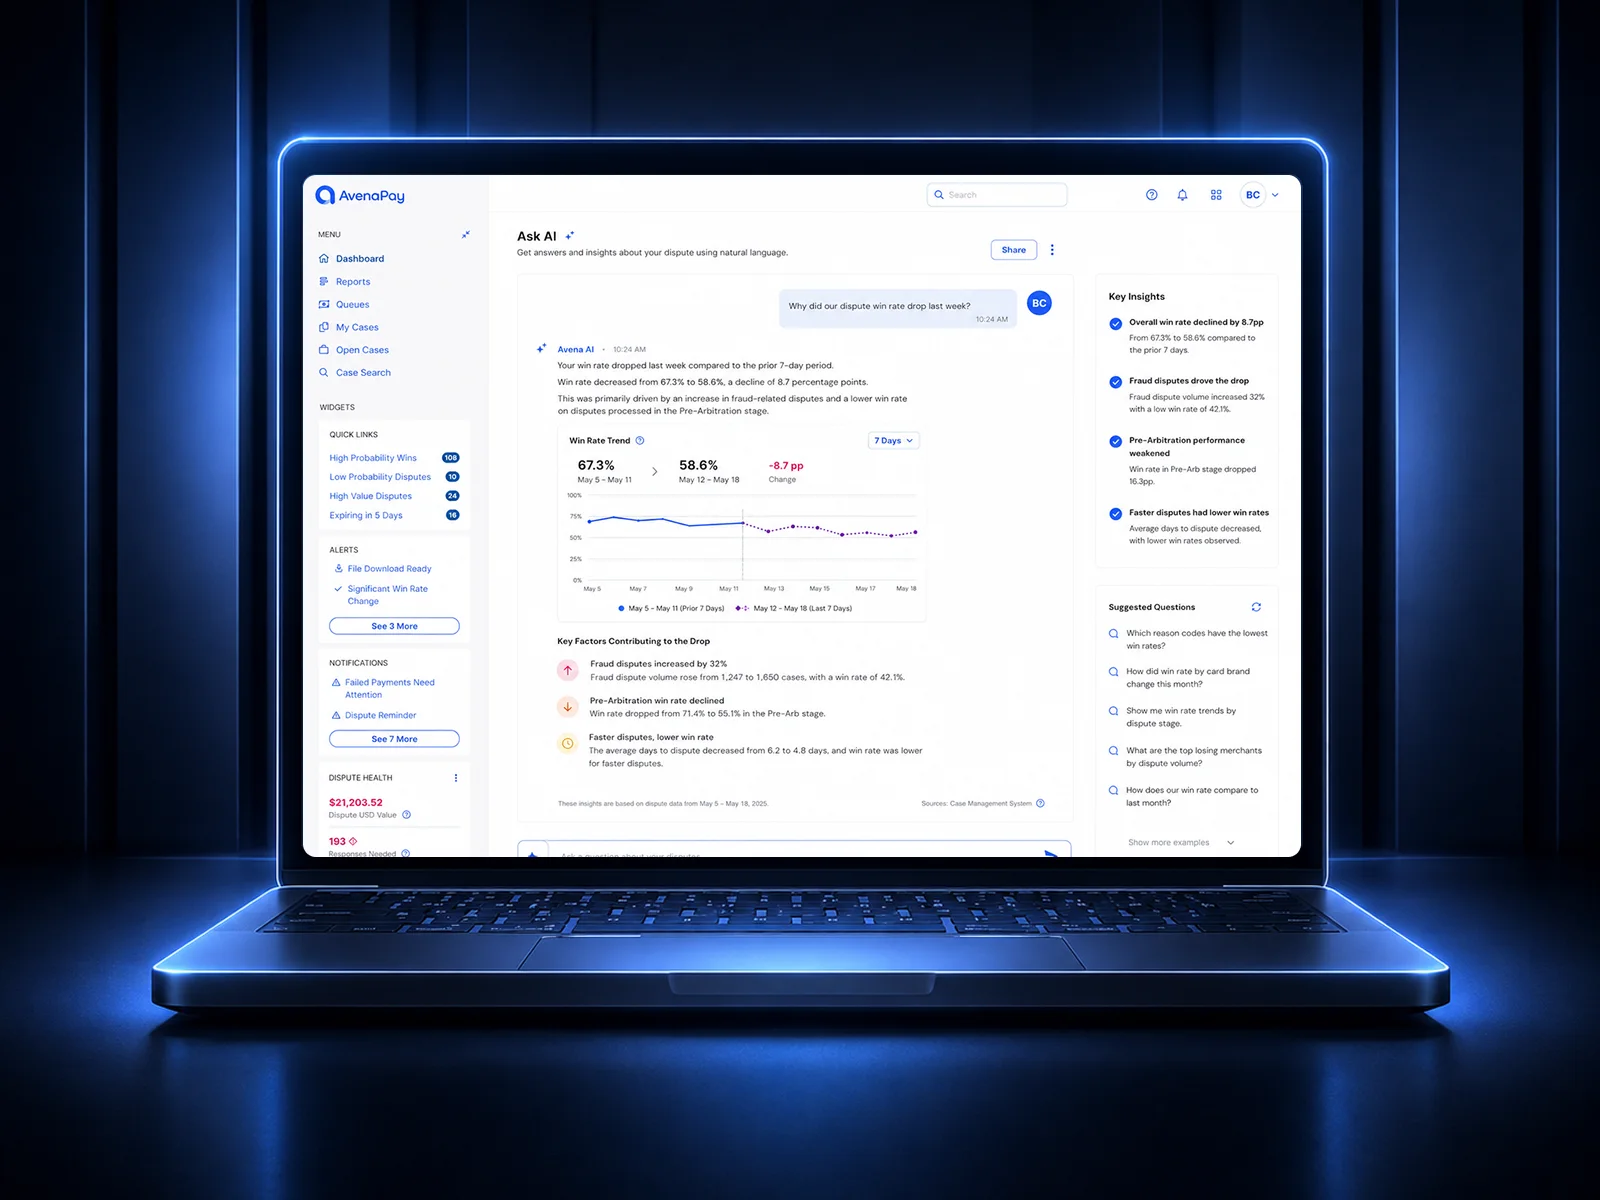
Natural-language analysis gives merchants another way to explore dispute data. Answers pair a concise explanation with supporting measures and follow-up questions, so an emerging concern can become a focused investigation.
Choose a suggested question or ask about win rate, fraud, or recovery.
Natural-language analysis gives merchants another way to explore dispute data. Answers pair a concise explanation with supporting measures and follow-up questions, so an emerging concern can become a focused investigation.
Interactive controls become available when the demonstration loads.
Interactive example 1
A clearer path through complex work.
The challenge
Merchants struggled to understand which disputes were worth defending, why cases were being lost, and how to recover more funds without relying on manual reports from support or client services. Complex dispute data needed to become easier to understand, filter, and act on.
My approach
I designed the dashboard strategy, information architecture, dispute-health KPIs, probability scoring, filtered queue shortcuts, case detail views, alerts, custom reports, and natural-language analytics.1
A supporting design-process visual has not been added.
Notes on these examples
-
Representative work, recreated to protect confidential information. These interactive examples use illustrative data; no real cases are changed. Interface, branding, data, and identifying details have been recreated. Sample dates, totals, probability scores, and trends are demonstration content, not claims about project results. Natural-language answers are scripted; nothing is submitted or emailed.
The original portfolio mockups retain their original colors. Theme switches change only the authored interactive recreation or placeholder beside their section.
- Outcomes portfolio mockup
- Volume portfolio mockup
- Case details portfolio mockup
- Alerts portfolio mockup
- Reporting portfolio mockup
- Ask AI portfolio mockup
Return to summary · approach · Outcomes · Volume · Case details · Alerts · Reporting · Ask AI